Economic reports continue to be positive as the service sectors experienced another month of growth in August. Construction spending rose and light vehicle sales surged to their highest level since early-2006. Moreover, the trade deficit declined, led by gains in exports. The Fed’s latest Beige Book survey reported that economic activity picked up during the summer and the economic outlook has brightened. The ISM manufacturing report was very positive and factory orders rose sharply. Job growth was lower than the month before and the unemployment rate just barely budged down, but despite the deceleration in August, job growth since the beginning of the year has averaged 215,000 per month - the best performance in more than a decade.
The ISM report indicates that the chemical industry was one of the 17 manufacturing industries reporting expansion in August. Production expanded as did new orders, which is good for future production. The backlog of orders, however, contracted. Export orders expanded as did imports. Inventories trended higher during the month and slower supplier deliveries were noted. Customer inventories were deemed to too low. Employment increased during the month. One chemical industry respondent noted that "Demand in the United States is consistent and geopolitics remains a concern.”
This ISM report is of significance to the business of chemistry because on average, the goods sectors purchase $43 worth of chemistry for every $1,000 worth of output (or revenues). In contrast, the services sectors purchase only $11 for every $1,000 worth of output. As a result, production of basic industrial chemicals and specialties tends to track this PMI fairly well.
Construction spending on new chemical manufacturing facilities surged to a $29.6 billion pace, an all-time high. This level of construction spending reflects new capacity being built to take advantage of abundant natural gas and NGL supplies. Spending has surged recently as several large projects have broken ground.
Chemical equities also continued to outperform the broader market. Throughout August, the S&P 500 index for chemical companies also rose by 3.8%. Equity prices are often a good indicator of future activity and represent one component of the leading economic indicators. The S&P chemicals index was up 10.1% from the beginning of the year. By comparison, the S&P 500 index was up 8.4% from the start of the year.
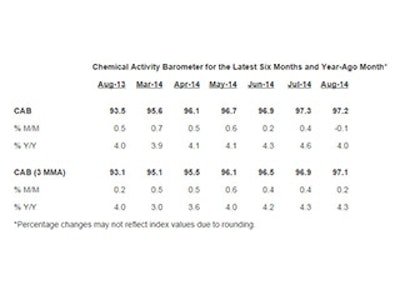
Additionally, the Chemical Activity Barometer continued to see moderated upward growth this month, with a 0.2 percent gain over July as measured on a three-month moving average (3MMA). This represented a deceleration from the 0.4 percent gain in July and an average gain of 0.5 percent for the first six months of 2014. Despite the softening pace, the August CAB marked a string of gains going back to April 2013. Though the pace of growth has slowed, current gains have the CAB up a solid 4.3 percent over this time last year, and the barometer remains at its highest level since January 2008. 
“Consistent with other recent economic reports, including the Conference Board and the Chicago Fed National Activity Index, the Chemical Activity Barometer continues to point to a slowly expanding U.S. economy, at least through the first quarter of 2015,” said Dr. Kevin Swift, chief economist at ACC. “What makes the CAB unique however, is its lead time in predicting the ebbs and flows of the economy, and the slight drag on plastic resins used in consumer and institutional applications parallels the weaker consumer confidence we are seeing,” Swift added.
Though the production indicator was flat in August, construction-related coatings, pigments and other performance chemistries remained strong. Likewise, chemical equities outpaced the broader market this month. Commenting further on this month’s results, Swift also noted that despite renewed economic troubles in Europe, China, and Latin America, U.S. exports are picking up with the United Kingdom and our NAFTA partners.
The Chemical Activity Barometer is a leading economic indicator derived from a composite index of chemical industry activity. The chemical industry has been found to consistently lead the U.S. economy’s business cycle given its early position in the supply chain, and this barometer can be used to determine turning points and likely trends in the wider economy. Month-to-month movements can be volatile so a three-month moving average of the barometer is provided. This provides a more consistent and illustrative picture of national economic trends.