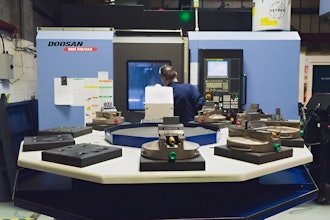
Your ability to use available equipment, labor, and floor space efficiently forms the backbone of strong production performance.
Capacity and resource utilization KPIs
1. Capacity Utilization
This metric measures how much of your maximum production capacity is actually being used.
Formula: (Actual output / Maximum possible output) × 10
This KPI helps identify both idle capacity and when operations are stretched too thin.
2. Machine Utilization
Similar to capacity utilization but focused on individual machines.
Formula: (Machine run time / Available machine time) × 100
Tracking it helps pinpoint maintenance issues, setup delays, and material flow problems.
3. Production Downtime
Downtime is any period when equipment or lines are not operating.
Formula: Total available time – Operating time
Separating planned from unplanned downtime provides insight into maintenance needs and process stability. Reducing unplanned downtime is one of the fastest ways to improve output without new investment.
Scheduling and forecasting KPIs
These KPIs track how well production aligns with scheduling needs and demand expectations.
4. Production and Customer Lead Time
Production Lead Time is how long it takes to complete a product once production begins.
Customer Lead Time covers the entire order lifecycle, from order receipt to delivery.
Formulas:
Production lead time = End date of production – Start date of production
Customer lead time = Delivery date – Order placement date
Shorter lead times support accurate quoting and better customer relationships.
5. Forecast Accuracy
Forecast accuracy measures how closely projected demand aligns with actual demand.
Formula: (1 – (Forecast – Actual) / Actual) × 100
Accurate forecasting enables small manufacturers to balance stock levels, prevent stockouts, and maintain healthy working capital.
6. Stockout Rate
This KPI tracks how often production or shipments are delayed due to missing materials.
Formula: (Number of stockout events / Total orders or production runs) × 100
A high stockout rate signals procurement, forecasting, or supplier reliability issues.
Cost control KPIs
Cost KPIs highlight how resources are being spent across the production process.
7. Cost per Unit
This reflects the total cost to produce one unit, including materials, labor, and overhead.
Formula: Total manufacturing cost / Units produced
It’s essential for pricing decisions and margin management.
8. Scrap and Rework Cost
This captures the cost of wasted materials and labor spent correcting defects.
Formulas:
Scrap cost = Quantity of scrapped units × Cost per unit (up to scrap point)
Rework cost = Quantity of reworked units × Cost of rework per unit
Total scrap and rework cost = Cost of scrapped units + Cost of reworked units
Scrap and rework directly erode profitability and often point to equipment, training, or process design issues.
9. Cost Variance
This compares actual production cost to the planned or standard cost.
Formula: Actual cost – Standard cost
A positive variance indicates overruns and signals the need to investigate inefficiencies or supplier changes.
Quality KPIs
Quality KPIs support strong production planning by reducing rework, delays, and customer dissatisfaction.
10. First Pass Yield (FPY)
The percentage of units that meet quality requirements the first time.
Formula: (Units passing inspection on first attempt / Total units) × 100
Higher FPY means less waste, faster throughput, and lower cost per unit.
11. On-Time Delivery Rate (OTD)
The percentage of orders delivered on schedule.
Formula: (Orders delivered on time / Total orders) × 100
For SMBs, reliability is often a major competitive advantage; strong OTD performance helps build trust and repeat business.
Simplifying KPI tracking with manufacturing software
Tracking these KPIs manually with spreadsheets is time-consuming and prone to error. Modern production planning software automates data collection, provides real-time visibility, and supports better decision-making. MRPeasy, for example, offers built-in KPI dashboards along with production scheduling, inventory control, and purchasing tools. It also integrates with Microsoft Power BI for advanced reporting.
For growing manufacturers, adopting an integrated system is one of the most cost-effective ways to improve operational control, support scaling, and maintain consistent delivery performance.
Find more production planning KPIs with examples at www.mrpeasy.com/blog/production-planning-kpis/