 Amanda Brooks
 Jim Niles
 Saving millions of dollars and improving efficiency and quality is an intriguing proposition for many manufacturers. Luckily, visualizing their data through business dashboards can help any organization easily spot hidden trends, pin point problem areas and accomplish goals faster.
Dashboard technology provides decision-makers with the ability to coordinate and display large amounts of data in a clear and concise way. They offer a user-friendly single-screen display that allows users to gain a detailed understanding of their business by drilling down into a wide range of variables — like waste, quality and performance — and connect that data to key metrics that can reveal important trends and relationships that may have been otherwise overlooked.
Manufacturing advantages
The combination of clarity and detail provided by dashboards can be incredibly beneficial. Dashboards not only allow better data management, but also provide a greater and deeper understanding of that data at a glance. Manufacturing professionals can leverage that understanding to create improved operational efficiencies across the board — with potentially significant results.
Sleep Innovations, for example, leveraged its dashboard solution to save more than $1 million annually by reducing scrap waste through yield optimization. Similarly, Atlantic States Cast Iron Company, a national producer of ductile iron pipe, implemented a dashboard to combine its SQL and Excel data in one visual platform, and discovered a vast improvement in their operational costs. In fact, the company typically lost between $1 and $3 million in scrap metal. Using dashboard technology, they were able to correct those losses, reducing their scrap rate from 4.62 tons to 3.82 tons over the course of one year — a significant cost savings.
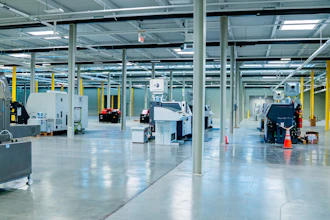
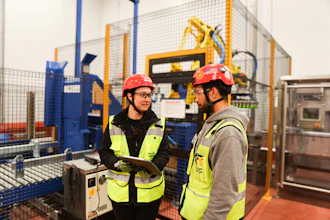
The ability to reign in this type of information by tracking consistency and performance throughout the entire supply chain can quickly identify problems before they become an issue. Dashboard software can monitor equipment, and the dashboards can be projected with LCD screens throughout the factory floor in real-time so that everyone can stay informed and take ownership of their part of the process.
In an industry where minor problems with just one or two pieces of equipment can cause major production issues, real-time monitoring can make a significant difference in reference to scheduled vs. unscheduled downtime. Built-in alerts can notify designated users when custom-designed thresholds are exceeded, alerting decision-makers to problems the moment they begin to emerge.
The real advantage of leveraging dashboard technology comes from the fact that they can be deployed in virtually any area or under any circumstance where an abundance of data exists. Precoat Metals, the largest coil coater in the U.S., has developed dozens of dashboards across its entire organization, including the quality, marketing, sales and finance departments, to support strategic decision making. Perhaps most notably, the company has saved more than 15 hours each month across multiple locations by automating their data collection and the dashboard/chart building process. With the standardization of reporting, they can more effectively communicate their margins of success and speak to the same metrics throughout the entire organization.
There are so many variables and complexities in a modern manufacturing operation that the ability to drilldown on a specific metric is critical. Dashboards make it possible to pinpoint exactly where a problem is coming from, eliminating guesswork and delays. The result includes identifying issues and inefficiencies, making it possible for them to be directly addressed and resolved.
Dashboard best practices
As with any new tool, it is important to know and understand some of the basic best practices for working with a dashboard in order to maximize your experience:
- Set priorities. Where will the dashboard make the most immediate impact? Prioritize where it is needed most and deploy accordingly, and then continue a more comprehensive rollout across the organization as needed.
- Be strategic. Dashboards are only as good as the information that goes into them. Determine which data is mission critical, and what specific metrics provide the most accurate view of that data.
- Don’t neglect training. The best dashboard solutions should be intuitive and user-friendly, but that doesn’t mean training isn’t important for achieving optimal results. Manufacturers should consider working with a dashboard consultant/provider that offers both initial training and long-term maintenance and support.
- Establish parameters. Different users will inherently require access to very different metrics. When implementing a dashboard, you will need to understand and make decisions around who needs to see which data and how. Be sure to have role-based permissions so that users will be able to view metrics pertaining to them.
Dashboards are incredibly valuable in a manufacturing setting because they make it possible to bridge the gap between information and insight. They take vast amounts of information and present it in a clear and concise manner using advanced data visualization and presentation techniques. The results can range from dozens of man-hours saved to millions of dollars protected from unnecessary spending — a value proposition that any manufacturer looking to improve their bottom line can get behind.
Amanda Brooks and Jim Niles are manufacturing dashboard specialists with iDashboards.