 Fabio Terezinho
For food manufacturers, big data starts on the plant floor in smart edge devices, which are typically connected to controllers, and sometimes directly to HMIs. Modern HMIs can collect, organize and use this data — but trying to figure out what data needs to be handled by the HMI is difficult.
In many cases, too much data is collected because it’s inexpensive to do so. Streamlining big data systems and making them more efficient requires focus on just what data should be collected. Once this is done, users can turn to the “how” of big data.
This article briefly explains just what data should be collected and why. It then looks at how data is collected locally, remotely and in the cloud — and then turned into actionable information for users.
Why Big Data
When developing a big data system, users need to start with what data should be collected and why. Collecting data without answering these questions can be a waste of money, resources and time — so it’s important to understand the ultimate goal, which will also become the business case justifying the proposed project.
Is it predictive maintenance for machines? To determine which shift is more efficient? To find the most common causes of downtime? To find out why one machine is less productive than another? Is it a combination of these reasons, along with others?
Although starting with the “why” may seem obvious and logical, it’s often not the reality. Many end users instead design the data collection system first, then decide what they are going to do with the data. But by starting with the “why,” big data projects will flow properly because a clearer path to expected future results is defined up front.
Processing Data at the Edge
With the need for specific data understood and defined, defining just how to implement the project is the next phase. This technical development and requirements phase starts at the edge by collecting the data and feeding it to the HMI, where it can be filtered and then pushed to the cloud, or to an on-premises data storage system.
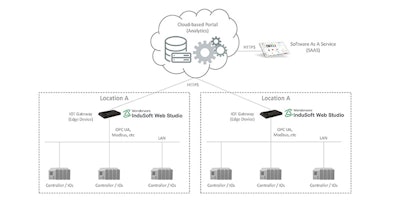
For most projects, data collection starts with an edge device. A popular, recent definition of edge devices labels them as gateways to collect information and push it to a central repository, which is often resides in the cloud. It could be a public cloud, a hybrid cloud or a private cloud located on premise. In either case, it’s a storage place to collect data being pushed there by edge devices through controllers and an HMI (Figure 1).
This is the normal data path, but it’s often more efficient to use an edge device that not only pushes data to a central repository, but also manipulates and filters the data. This filtering allows data collection to be streamlined at its point of origination. For example, it may not be necessary to collect data once a second from a temperature transmitter on a baking oven, but instead to only collect it when it changes by a certain amount, referred to as reporting by exception.
 Figure 1 – Big data starts with connecting edge devices and controllers to HMIs, which act as gateway to networks, the cloud and analytics software as a service. (Image courtesy of InduSoft)
HMIs Normalize the Data
A big data central depository accomplishes three main tasks: data acquisition, manipulation and presentation. For data acquisition, interoperability via various communication methods is critical.
A modern HMI comes with communication drivers supporting more than 200 different protocols, allowing it to communicate with a variety of edge devices and controllers. Two such protocols gaining in popularity are OPC UA and message queueing telemetry transport (MQTT). MQTT is an ISO standard (ISO/IEC PRF 20922) messaging protocol for use on top of the TCP/IP protocol, designed to push data to the cloud in a flexible publisher/subscriber model.
The HMI doesn’t just provide the drivers needed to communicate with edge devices and controllers, it also provides interoperability in a much broader sense by communicating with data repositories, such as local databases and/or ERP systems. It also adds flexibility with toolkits and APIs to integrate proprietary edge devices and controllers. Moreover, edge device HMIs can also provide store-and-forward capabilities to retain data even if the connection with the data storage system is temporarily unavailable.
Once data is collected, the HMI consolidates and filters it before pushing it to a data repository, making big data system implementation technically feasible, meaningful, accurate and cost-efficient.
Using the Data
With data collected, filtered and efficiently pushed to long-term storage — this information can then be used to reduce waste, increase productivity and improve quality.
In food manufacturing applications, there are often many machines, each with a basic HMI used mostly for operator interface and local operation. But in many plants, it’s becoming necessary to make decisions not only on the operational level, but also strategically at the plant or even the enterprise level. To help make these decisions, overall equipment effectiveness (OEE) measurements are often needed to better understand production, productivity and quality on the plant floor.
OEE is a good starting point for comparing different machines in the same plant, or across multiple plants. Some HMIs include templates to simplify the process of normalizing information for comparison purposes (Figure 2). These templates include tools to analyze downtime and determine root causes. The HMI can also measure, organize and present the causes of downtime.
 Figure 2 – OEE dashboards provide a way to normalize information, and to analyze downtime for determination of root causes. (Image courtesy of InduSoft)
If the measures and causes used for the comparison are the same across the board, then variations from machine to machine and from plant to plant can be used to make strategic decisions. This information can be used to highlight required changes, such as tweaking machine operation or training personnel. Normalized data may also show that methodologies from one plant should be adopted at another.
Big data implementations require collecting, normalizing and presenting data to plant personnel and managers so they can make decisions from a strategic point of view. HMIs are a key part of these implementations, and are moving beyond their traditional operator interface functionality to provide strategic information for improving machine and plant operation.