Tuesday, November 22, 2011; Arlington, VA. Investment in business equipment and increased exports will be the drivers for economic growth over the next five years as the U.S. economy rebalances away from excessive reliance on debt-based consumer spending, according to a new report.
The Manufacturers Alliance/MAPI Quarterly Economic Forecast predicts that inflation-adjusted gross domestic product (GDP) will expand by 1.8 percent in 2011, by 2.1 percent in 2012, and by 2.4 percent in 2013. The 2011 forecast represents a slight upgrade over the previously estimated 1.6 percent growth, while the 2012 forecast is on par with 2.1 percent growth anticipated in the August 2011 quarterly report. MAPI’s November report traditionally provides a five-year forecast; GDP is predicted to average 2.9 percent annual growth from 2012 to 2016.
“Recently, the U.S. economy has performed a bit stronger than we thought, yet there is no indication of significant improvement, so we kept the growth rates for 2011 and 2012 in the same range,” said Daniel J. Meckstroth, Ph.D., MAPI Chief Economist. “Consumer spending is restrained by sluggish job growth and minimal wage increases, and combined with the impaired housing market, we do not foresee a return to debt-based growth. Instead, drivers will be increased investment in business equipment and trade. Also, we are seeing some modest growth in non-residential construction, suggesting that the sector’s recession is bottoming out.”
Manufacturing production will outpace the overall economy and is expected to show growth of 4.3 percent in 2011, 3.4 percent in 2012, and 3.8 percent in 2013. The 2011 and 2012 figures have been adjusted upward from MAPI’s August forecast of 4.1 percent and 3.2 percent, respectively. Manufacturing is expected to see a net increase in hiring, with the sector forecast to add 230,000 jobs in 2011, 170,000 in 2012, and 140,000 in 2013.
There remain, however, a number of red flags for the outlook.
“The risk of another recession is uncomfortably high; we put the probability at 40 percent for 2011,” Meckstroth said. “The main risk is that the European sovereign debt crisis may cascade from European banks to the U.S. banking system and interfere with interbank lending and, ultimately, credit availability. Another concern is that job growth will stop. U.S. economic growth is already at a ‘stall speed’ of 2 percent or less, and if we had a major shock it could precipitate a major crisis.
“Additionally, there is already a shift from fiscal government stimulus to austerity that we expect to last the next five years or more, as U.S. politicians attempt to get control of our unwieldy public debt,” he added.
Production in non-high-tech industries is expected to increase by 4.1 percent in 2011, by 3.3 percent in 2012, and by 3.2 percent in 2013. High-tech manufacturing production, which accounts for approximately 10 percent of all manufacturing, is anticipated to improve at a higher rate, with growth of 7.6 percent in 2011, 5.8 percent in 2012, and 10.4 percent in 2013.
The forecast for inflation-adjusted investment in equipment and software is for growth of 10.7 percent in 2011, 7.9 percent in 2012, and 7.7 percent in 2013. Capital equipment spending in high-tech sectors will also rise. Inflation-adjusted expenditures for information processing equipment are anticipated to increase by 6.5 percent in 2011, by 7.8 percent in 2012, and by 6.9 percent in 2013.
MAPI expects industrial equipment expenditures to advance by 12.1 percent in 2011, by 10 percent in 2012, and by 5.2 percent in 2013. The outlook for spending on transportation equipment is for growth of 26.1 percent in 2011, 12.7 percent in 2012, and 12.3 percent in 2013. Spending on non-residential structures will improve by 5.1 percent in 2011 before decelerating to 3.8 percent in 2012, and to 2 percent in 2013.
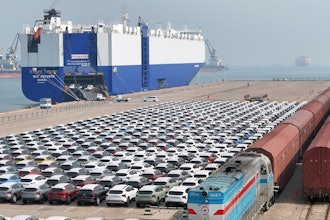
Exports and imports will both see gains. Inflation-adjusted exports are anticipated to improve by 6.7 percent in 2011, by 4.8 percent in 2012, and by 7.1 percent in 2013. Imports are expected to grow by 4.8 percent in 2011, by 3 percent in 2012, and by 4.9 percent in 2013. Over the five-year horizon from 2012 to 2016, exports are expected to average 7.1 percent growth compared to 4.1 percent growth for imports. MAPI forecasts overall unemployment to remain high, averaging 9.1 percent in 2011, 9 percent in 2012, and 8.8 percent in 2013.
The price per barrel of imported crude oil is expected to average $100.30 per barrel in 2011, $99.10 per barrel in 2012, and $101 in 2013.
Manufacturers Alliance/MAPI Economic Forecast
GDP Expenditure Categories | Inflation-Adjusted Percent Change | |||||
2011(F) | 2012(F) | 2013(F) | 2014(F) | 2015(F) | 2016(F) | |
Gross Domestic Product | 1.8 | 2.1 | 2.4 | 3.5 | 3.4 | 2.9 |
Total Consumption | 2.3 | 2.2 | 2.1 | 2.3 | 2.4 | 2.3 |
Durables | 7.6 | 5.4 | 5.9 | 3.8 | 4.6 | 4.7 |
Nondurables | 1.8 | 1.8 | 1.9 | 1.6 | 1.4 | 1.6 |
Services | 1.6 | 1.8 | 1.6 | 2.3 | 2.4 | 2.1 |
Nonresidential Fixed Investment | 9.1 | 6.8 | 6.2 | 9.0 | 8.1 | 4.7 |
Equipment & Software | 10.7 | 7.9 | 7.7 | 8.5 | 6.7 | 3.7 |
Information Processing Equipment | 6.5 | 7.8 | 6.9 | 9.6 | 7.5 | 6.0 |
Industrial Equipment | 12.1 | 10.0 | 5.2 | 3.7 | 6.4 | 1.8 |
Transportation equipment | 26.1 | 12.7 | 12.3 | 7.2 | 0.7 | -6.5 |
Structures | 5.1 | 3.8 | 2.0 | 10.4 | 12.1 | 7.4 |
Residential Fixed Investment | -1.9 | 6.8 | 15.6 | 25.6 | 15.8 | 5.1 |
Exports | 6.7 | 4.8 | 7.1 | 8.3 | 7.8 | 7.5 |
Imports | 4.8 | 3.0 | 4.9 | 5.1 | 4.1 | 3.4 |
Federal Government | -1.7 | -2.9 | -3.6 | -2.9 | -2.0 | -1.3 |
State & Local Government | -2.3 | -2.5 | -0.7 | 0.4 | 0.7 | 0.9 |
F=Forecast; Source: MAPI, November, 2011
Manufacturers Alliance/MAPI Economic Forecast
Economic Indicators | Percent Change or Level as Specified | |||||
2011(F) | 2012(F) | 2013(F) | 2014(F) | 2015(F) | 2016(F) | |
Prices (% change.) |
|
|
|
|
|
|
Consumer Prices | 3.2 | 1.6 | 1.6 | 1.9 | 2.2 | 2.2 |
Excluding Food & Energy | 1.7 | 1.6 | 1.6 | 2.0 | 2.2 | 2.2 |
Producer Prices, Finished Goods | 6.0 | 1.0 | 1.0 | 1.0 | 1.7 | 1.6 |
Energy ($) |
|
|
|
|
|
|
Imported Crude Oil ($ per barrel) | $100.3 | $99.1 | $101.0 | $103.1 | $104.6 | $105.9 |
Natural Gas Wellhead Price ($ mmbtu) | $4.0 | $3.8 | $4.2 | $4.5 | $4.7 | $4.9 |
Other Key Measures |
|
|
|
|
|
|
Nonfarm Inventory Change (Billion 2005$) | $38 | $41 | $52 | $59 | $49 | $43 |
Light Vehicle Sales (Million units) | 12.6 | 13.4 | 14.8 | 15.7 | 16.3 | 16.6 |
Housing Starts (Million units) | 0.605 | 0.724 | 0.955 | 1.348 | 1.624 | 1.734 |
Federal Surplus (NIPA, Billion $) | -$1,194 | -$1,005 | -$718 | -$640 | -$598 | -$616 |
Current Account Balance (Billion $) | -$458 | -$457 | -$422 | -$455 | -$505 | -$492 |
Labor |
|
|
|
|
|
|
Unemployment Rate (%) | 9.1 | 9.0 | 8.8 | 8.1 | 7.3 | 6.8 |
Payroll employment (% change.) | 1.0 | 1.1 | 1.5 | 2.0 | 2.0 | 1.7 |
Production (% change.) |
|
|
|
|
|
|
Manufacturing - SIC Basis | 4.3 | 3.4 | 3.8 | 4.5 | 4.4 | 3.2 |
Computers & Electronic Products | 7.6 | 5.8 | 10.4 | 14.6 | 14.4 | 13.0 |
Non-High-Tech Manufacturing | 4.1 | 3.3 | 3.2 | 3.5 | 3.7 | 2.5 |
F=Forecast; Source: MAPI, November, 2011


