Arlington, VA. — After a slow first half of 2013, expectations are for the U.S. economy to gradually return to moderate growth in the second half and through 2014, according to a new forecast.
The Manufacturers Alliance for Productivity and Innovation (MAPI) Quarterly Economic Forecast predicts that inflation-adjusted gross domestic product (GDP) will expand 1.6 percent in 2013 and 2.8 percent in 2014, the former down from 1.8 percent and the latter showing no change from MAPI’s May 2013 report.
Manufacturing production is expected to fare somewhat better than the overall economy, with anticipated 2.2 percent growth in 2013 and 3.2 percent growth in 2014. The 2013 forecast is a decrease from 3.1 percent and the 2014 estimate is down from 3.6 percent predicted in the May forecast.
The report also takes an initial look at 2015, when GDP is expected to rise 3.4 percent and manufacturing production should accelerate at a 4.1 percent clip.
“The outlooks for both the U.S. economy and the global economy are falling into place,” noted MAPI Chief Economist Daniel J. Meckstroth, Ph.D. “First half GDP growth in the U.S. was slow because of a number of factors—an increase in the payroll tax, the early effects of sequestration, and states’ austerity—taking a substantial amount out of the growth rate. But the payroll tax effect is diminishing and the sequester effect was not as disruptive as forecast; the government seems to be working around it. Additionally, Europe appears to be coming out of recession.”
Meckstroth notes that consumer spending is holding up reasonably well and business investment is growing at a moderate rate.
“Housing, despite being a lesser share of the economy, is nonetheless booming, and we’re convinced housing starts will be an economic driver,” he added. “This will have a positive domino effect on the supply chain and products that have been struggling, such as wood and glass and plastics products.”
Production in non-high-tech industries is expected to increase 2.1 percent in 2013 and 3.1 percent in 2014. High-tech manufacturing production, which accounts for less than 5 percent of all manufacturing, is anticipated to grow 5.2 percent in 2013 and 7.6 percent in 2014.
The forecast for inflation-adjusted investment in equipment is for growth of 4.2 percent in 2013 and 9.3 percent in 2014. Capital equipment spending in high-tech sectors will also rise. Inflation-adjusted expenditures for information processing equipment are anticipated to increase 5.9 percent in 2013 and 13.3 percent in 2014.
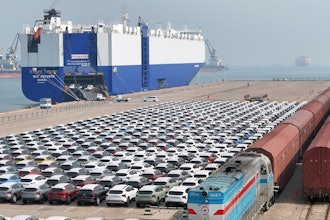
MAPI expects industrial equipment expenditures to advance 2.6 percent in 2013 and 9.8 percent in 2014. The outlook for spending on transportation equipment is for growth of 0.3 percent in 2013 and 5.9 percent in 2014. Spending on nonresidential structures will decline 1.3 percent in 2013 before improving 6.1 percent in 2014.
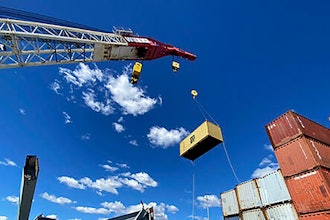
Inflation-adjusted exports are anticipated to increase 2.1 percent in 2013 and 4.7 percent in 2014. Imports are expected to grow 2.2 percent in 2013 and 6.8 percent in 2014. MAPI forecasts overall unemployment to average 7.6 percent in 2013, 7.1 percent in 2014, and 6.5 percent in 2015.
Slower production gains and strong productivity advances will affect prospects for manufacturing employment growth. Manufacturing is seeing a deceleration in hiring, and the sector is expected to add only 83,000 jobs in 2013, well below the May forecast of 137,000 jobs. The outlook is for an increase of 207,000 jobs in 2014, a significant decrease from the 352,000 previously forecast. The sector is expected to add 250,000 jobs in 2015.
The refiners’ acquisition price per barrel of imported crude oil is expected to average $96.80 in 2013 and $89.00 in 2014.
MAPI Economic Forecast
GDP Expenditure Categories | Inflation-Adjusted Percent Change | |||
2012 | 2013(F) | 2014(F) | 2015(F) | |
Gross Domestic Product | 2.8 | 1.6 | 2.8 | 3.4 |
Total Consumption | 2.2 | 2.0 | 2.7 | 2.6 |
Durables | 7.7 | 7.4 | 6.6 | 5.6 |
Nondurables | 1.4 | 2.1 | 2.5 | 1.7 |
Services | 1.6 | 1.1 | 2.1 | 2.5 |
Nonresidential Fixed Investment | 7.3 | 2.9 | 7.1 | 7.1 |
Equipment | 7.6 | 4.2 | 9.3 | 8.1 |
Information Processing Equipment | 2.7 | 5.9 | 13.3 | 11.1 |
Industrial Equipment | 5.5 | 2.6 | 9.8 | 8.1 |
Transportation Equipment | 22.2 | 0.3 | 5.9 | 2.9 |
Intellectual Property Products | 3.4 | 4.0 | 4.6 | 5.5 |
Structures | 12.7 | -1.3 | 6.1 | 7.4 |
Residential Fixed Investment | 12.9 | 13.6 | 18.1 | 19.6 |
Exports | 3.5 | 2.1 | 4.7 | 5.3 |
Imports | 2.2 | 2.2 | 6.8 | 5.0 |
Federal Government | -1.4 | -4.7 | 0.3 | -0.7 |
State & Local Government | -0.7 | -0.4 | 0.3 | 0.7 |
F=Forecast; Source(s): MAPI, August 2013
MAPI Economic Forecast
Economic Indicators | Percent Change or Level as Specified | |||
2012 | 2013(F) | 2014(F) | 2015(F) | |
Prices (% change) |
|
|
|
|
Consumer Prices | 2.1 | 1.4 | 1.4 | 1.8 |
Excl. Food & Energy | 2.1 | 1.8 | 1.9 | 1.9 |
Producer Prices, Finished Goods | 1.9 | 0.9 | 0.2 | 1.0 |
Energy ($) |
|
|
|
|
Imported Crude Oil ($ per barrel) | $101.1 | $96.8 | $89.0 | $90.5 |
Natural Gas Henry Hub Price ($mmbtu) | $2.7 | $3.8 | $4.1 | $4.2 |
Other Key Measures |
|
|
|
|
Nonfarm Inventory Change (Billion 2009$) | $69 | $43 | $55 | $64 |
Light Vehicle Sales (Million units) | 14.4 | 15.5 | 16.0 | 16.3 |
Housing Starts (Million units) | 0.783 | 0.941 | 1.227 | 1.559 |
Federal Surplus (NIPA, Billion $) | -$1,110 | -$766 | -$722 | -$682 |
Current Account Balance (Billion $) | -$440 | -$383 | -$370 | -$419 |
Labor |
|
|
|
|
Unemployment Rate (%) | 8.1 | 7.6 | 7.1 | 6.5 |
Payroll Employment (% change) | 1.7 | 1.7 | 1.7 | 1.8 |
Production (% change) |
|
|
|
|
Manufacturing (SIC Basis) | 3.9 | 2.2 | 3.2 | 4.1 |
Computers & Electronic Products | 6.3 | 5.2 | 7.6 | 8.9 |
Non-High-Tech Manufacturing | 3.9 | 2.1 | 3.1 | 4.0 |
F=Forecast; Source(s): MAPI, August 2013
The Manufacturers Alliance for Productivity and Innovation (MAPI), founded in 1933, contributes to the competitiveness of U.S. manufacturing by providing economic research, professional development, and an independent, expert source of manufacturing information. www.mapi.net