When we participate in the classes and courses for process improvement tools and techniques, we learn the power of knowledge that is facilitated by collecting data, and a great many powerful tools that are at our disposal to help us turn data into understanding so we can make informed, wise decisions. Bottom line, data is powerful.
Then we exit the training environment and return to the real world only to discover a difficult truth. There never seems to be enough data.
Sometimes the data we want isn’t collected like we asked, or it is suspect or corrupted. Sometimes we get one part of the data, but not a corresponding part that is necessary for our analysis. Sometimes the data arrives too late. Sometimes the cost of collecting the data seems to be too high. Sometimes we get the data we asked for, but its behavior is not conducive to a simple analysis and decision.
Data simply isn’t as miraculously pristine and available as it was in the training environment. There is another data danger as well. We also battle a phenomenon whereby people have drawn a conclusion, or wish to present a particular picture, and then go looking for data to support it, which is of course backwards. The challenge around the latter is recognizing when such is the case and knowing to look for other relevant data or how to look at the data with an objective eye.
So, when we don’t have the data we want or need to make the decisions, what are our options? I like to break the challenge into two categories of importance or urgency. The first is a situation in which we must have proof. The second is where we don’t necessarily need proof, but it is important to make an informed and wise decision.
By way of explaining the first group of circumstances, we need proof when we must demonstrate that we have satisfied a performance requirement or regulation. Sometimes we need proof to convince peers or leaders that a phenomenon is or is not taking place in order to settle an argument. Sometimes we need proof for legal reasons.
In most cases where we need proof, but we don’t have the data to prove our position, there isn’t much else to do but to get more data. Such is life. However, it’s not an “always” truth. Sometimes we do have alternatives.
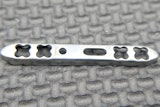
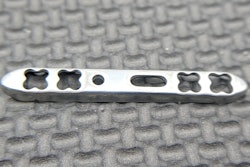
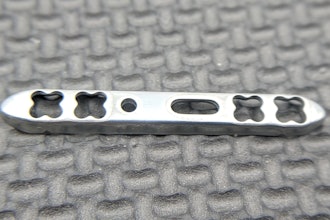
Here is a real example to provide some food for thought. A manufacturing firm produces a product that consists of a cover that is glued to a base material. In order to meet both customer requirements and safety regulations to permit the product to ship by conventional means, the firm must prove that the system meets certain fire resistance expectations. They prove it by burning samples and recording the burn rate of the system.
On the surface the challenge sounds simple; design it, build it, test it, certify it, and begin shipping. Life is rarely that simple. The firm uses several suppliers of the various materials in order to manage volume demands. Occasionally, the suppliers adjust formulas for material or treatments as part of process improvement or cost management, or to meet changing demands or supply. The adhesive is the greatest challenge to consistency.
Adhesives frequently change either in formula, cost, environmental acceptability, or for manufacturing needs. To improve processes, manage cost, or manage availability of supply, the firm is frequently experimenting with, or changing the adhesive used. There are also varying relative amounts of each component as each system is customized to meet customer needs. The resultant reality is that the combination of changes potentially drives a need to test and certify nearly every lot of product shipped in order to prove that safety regulations are met.
The cost and delay and difficulty of keeping track of so many changes and data over time are difficult to manage. Obviously, one strategy is to get all of the changing under control. While that is done, how might the manufacturing firm minimize the logistical nightmare of tracking all of the data and changes?
One option might be to use the historical data available to prove that further testing and proof is not necessary. If, for example, the firm can demonstrate that in combination with the various cover treatments and materials the adhesive produces negligible influence over the burn test results, it can make a case that adhesive changes should not require expensive re-testing every time.
A statistical tool for doing so is a Components of Variation (COV) study. A COV analysis will calculate the statistical probability of each component to influence the outcome. It requires either a continuous data output (a measurable, infinitely divisible output such as inches, degrees, minutes, or grams) or it requires an enormous amount of discrete data (yes/no, pass/fail, A-B-C) that includes both success and failure occurrences.
The COV study can be very useful, but it also has its limitations above and beyond the continuous data need. It generally requires a balanced data set, meaning an equivalent set of data points for every combination of components. Often, this can be accomplished by reducing the data set until it is balanced according to the least available combinations. This is dangerous because if the data is picked, it could bias the results. If you don’t have enough data and also enough examples of each possible combination for a statistically significant result, the COV study won’t provide a meaningful result.
So, if the COV study does work, it could provide statistical evidence in the example case that the various adhesives used in combination with the other materials do not significantly influence the outcome of the burn tests. Therefore, it should not be necessary to prove safety every time the adhesive changes. That can be a very powerful argument in a frequently changing environment.
If, however, the COV study does not resolve, then we must resort to arguments based on the data we do have and some common sense and experiential examination and reflection. If the proof needed is to convince a customer that a requirement is satisfied, this can work. Typically, when faced with a regulatory or legal need for proof, hard proof is required.
The ideas of common sense and experience bring us to two very important points. The first is inference space. Inference space is that behavior of a system about which we have data and observable information. For example, if we chart the acceleration of a dragster over a ¼-mile racetrack we might accurately predict its speed at any point in the track. However, we should not assume that we can accurately project its speed at a point beyond ¼-mile.
In the example above, evidence concerning combinations of the tested adhesive-cover-material system defines the inference space. While the manufacturing firm might be able to claim that studied combinations of each component do not need to be tested every time their relative measures are adjusted, if a new material, cover, or adhesive is introduced, that conclusion is no longer applicable. The new component creates a system outside of the inference space.
The first and easiest, common sense, challenge to any presentation of data is to compare the proposal and/or conclusions to the inference space of the data. If the recommendation is based on projections beyond the inference space, challenge them. Don’t present anything projected beyond the inference space as proof.
The second point to make concerning common sense and experience is that we can often make reasonably sound judgment calls based on our own experiential information from which mathematical models do not get to benefit. This is not always acceptable when we need regulatory or legal proof, but it can be very useful when making important process and business decisions.
When we don’t have the data we need to mathematically prove or otherwise have data reveal the truth of a situation, and we want or need to make an informed decision without waiting for or investing in more data, we can often reasonably make a decision based on what we know about the process, system, or environment from which the data would come. As humans we can make connections that data models can’t.
When our fancy data analyses and mathematical models fail us, we can rely on our experiential information to try and fill in the gaps. I believe that the best help in doing this is to chart the data we do have in the most visual way we can. Simple scatter plots, run charts, and histograms or dot plots often work best.
When we plot the data and examine it visually, we can begin to assess the gaps or the noise in the data with our experience. For example, a plot of data about a production system might not resolve using statistical tools because of a gap in data over the inference space. Our personal experience might tell us that the reason we don’t operate in that zone is because of personnel counts across shift changes, but that there is no “mechanical” influence on the system in the vacant zone.
In another discussion, outlier data points might make it difficult to resolve a trend mathematically, but our own experience might recall that one outlier struck us as a suspect data collection event, another looks like it could easily be a typo, and a third can’t be explained, but it clearly can’t be a real output of the system.
We know history about changes in the system, about the behaviors of people between shifts, about process improvement experiments, about the general behavior of our products in testing, and a great many other things. We know if what we are looking at is normal for the system, or if it is anomalous.
We can use this knowledge to supplement our data to help us make decisions or mitigate risk. There is some risk, however. The risk is that of rationalizing what we want or expect, rather than accepting what the data is really trying to tell us. A close friend, when presented with poor data and asked to interpret it, responds sarcastically by asking, “What would you like it to mean?”
I’d like to offer one last thought before wrapping up. The same graphical tools that allow us to see and perceive gaps in, or normal or anomalous behavior in, our data are best used before we do our fancy mathematical and statistical analyses. We can waste a great deal of time trying to figure out what is wrong with our models when an obvious typo is the culprit.
It’s not ideal to make decisions based on not enough data, but sometimes the urgency is real. With some honest objectivity, we can often fill in the gaps with understanding of the process or system from our own experience. We can often judge whether an outcome of concern is likely or improbable. Unfortunately, when we need absolute proof, our experience won’t cut it because there is the risk of creative interpretation or rationalization.
When we need proof, there might be some mathematical options like COV that, while they don’t necessarily provide an absolute measure, can statistically predict the probability of an outcome or the influence of a component or factor on an outcome that can substitute for direct observation. Unfortunately, even these options require certain data integrity to provide meaningful results.
Sometimes we just need more data. Sometimes we can hedge our bets with experience. Don’t be paralyzed just because you don’t have the data you want, but be responsible in how you fill in the blanks with experience and expert knowledge. After all, the whole point of using data is to make wise decisions. We can use our own inherent wisdom too.
Stay wise, friends.
If you like what you just read, find more of Alan’s thoughts at www.bizwizwithin.com